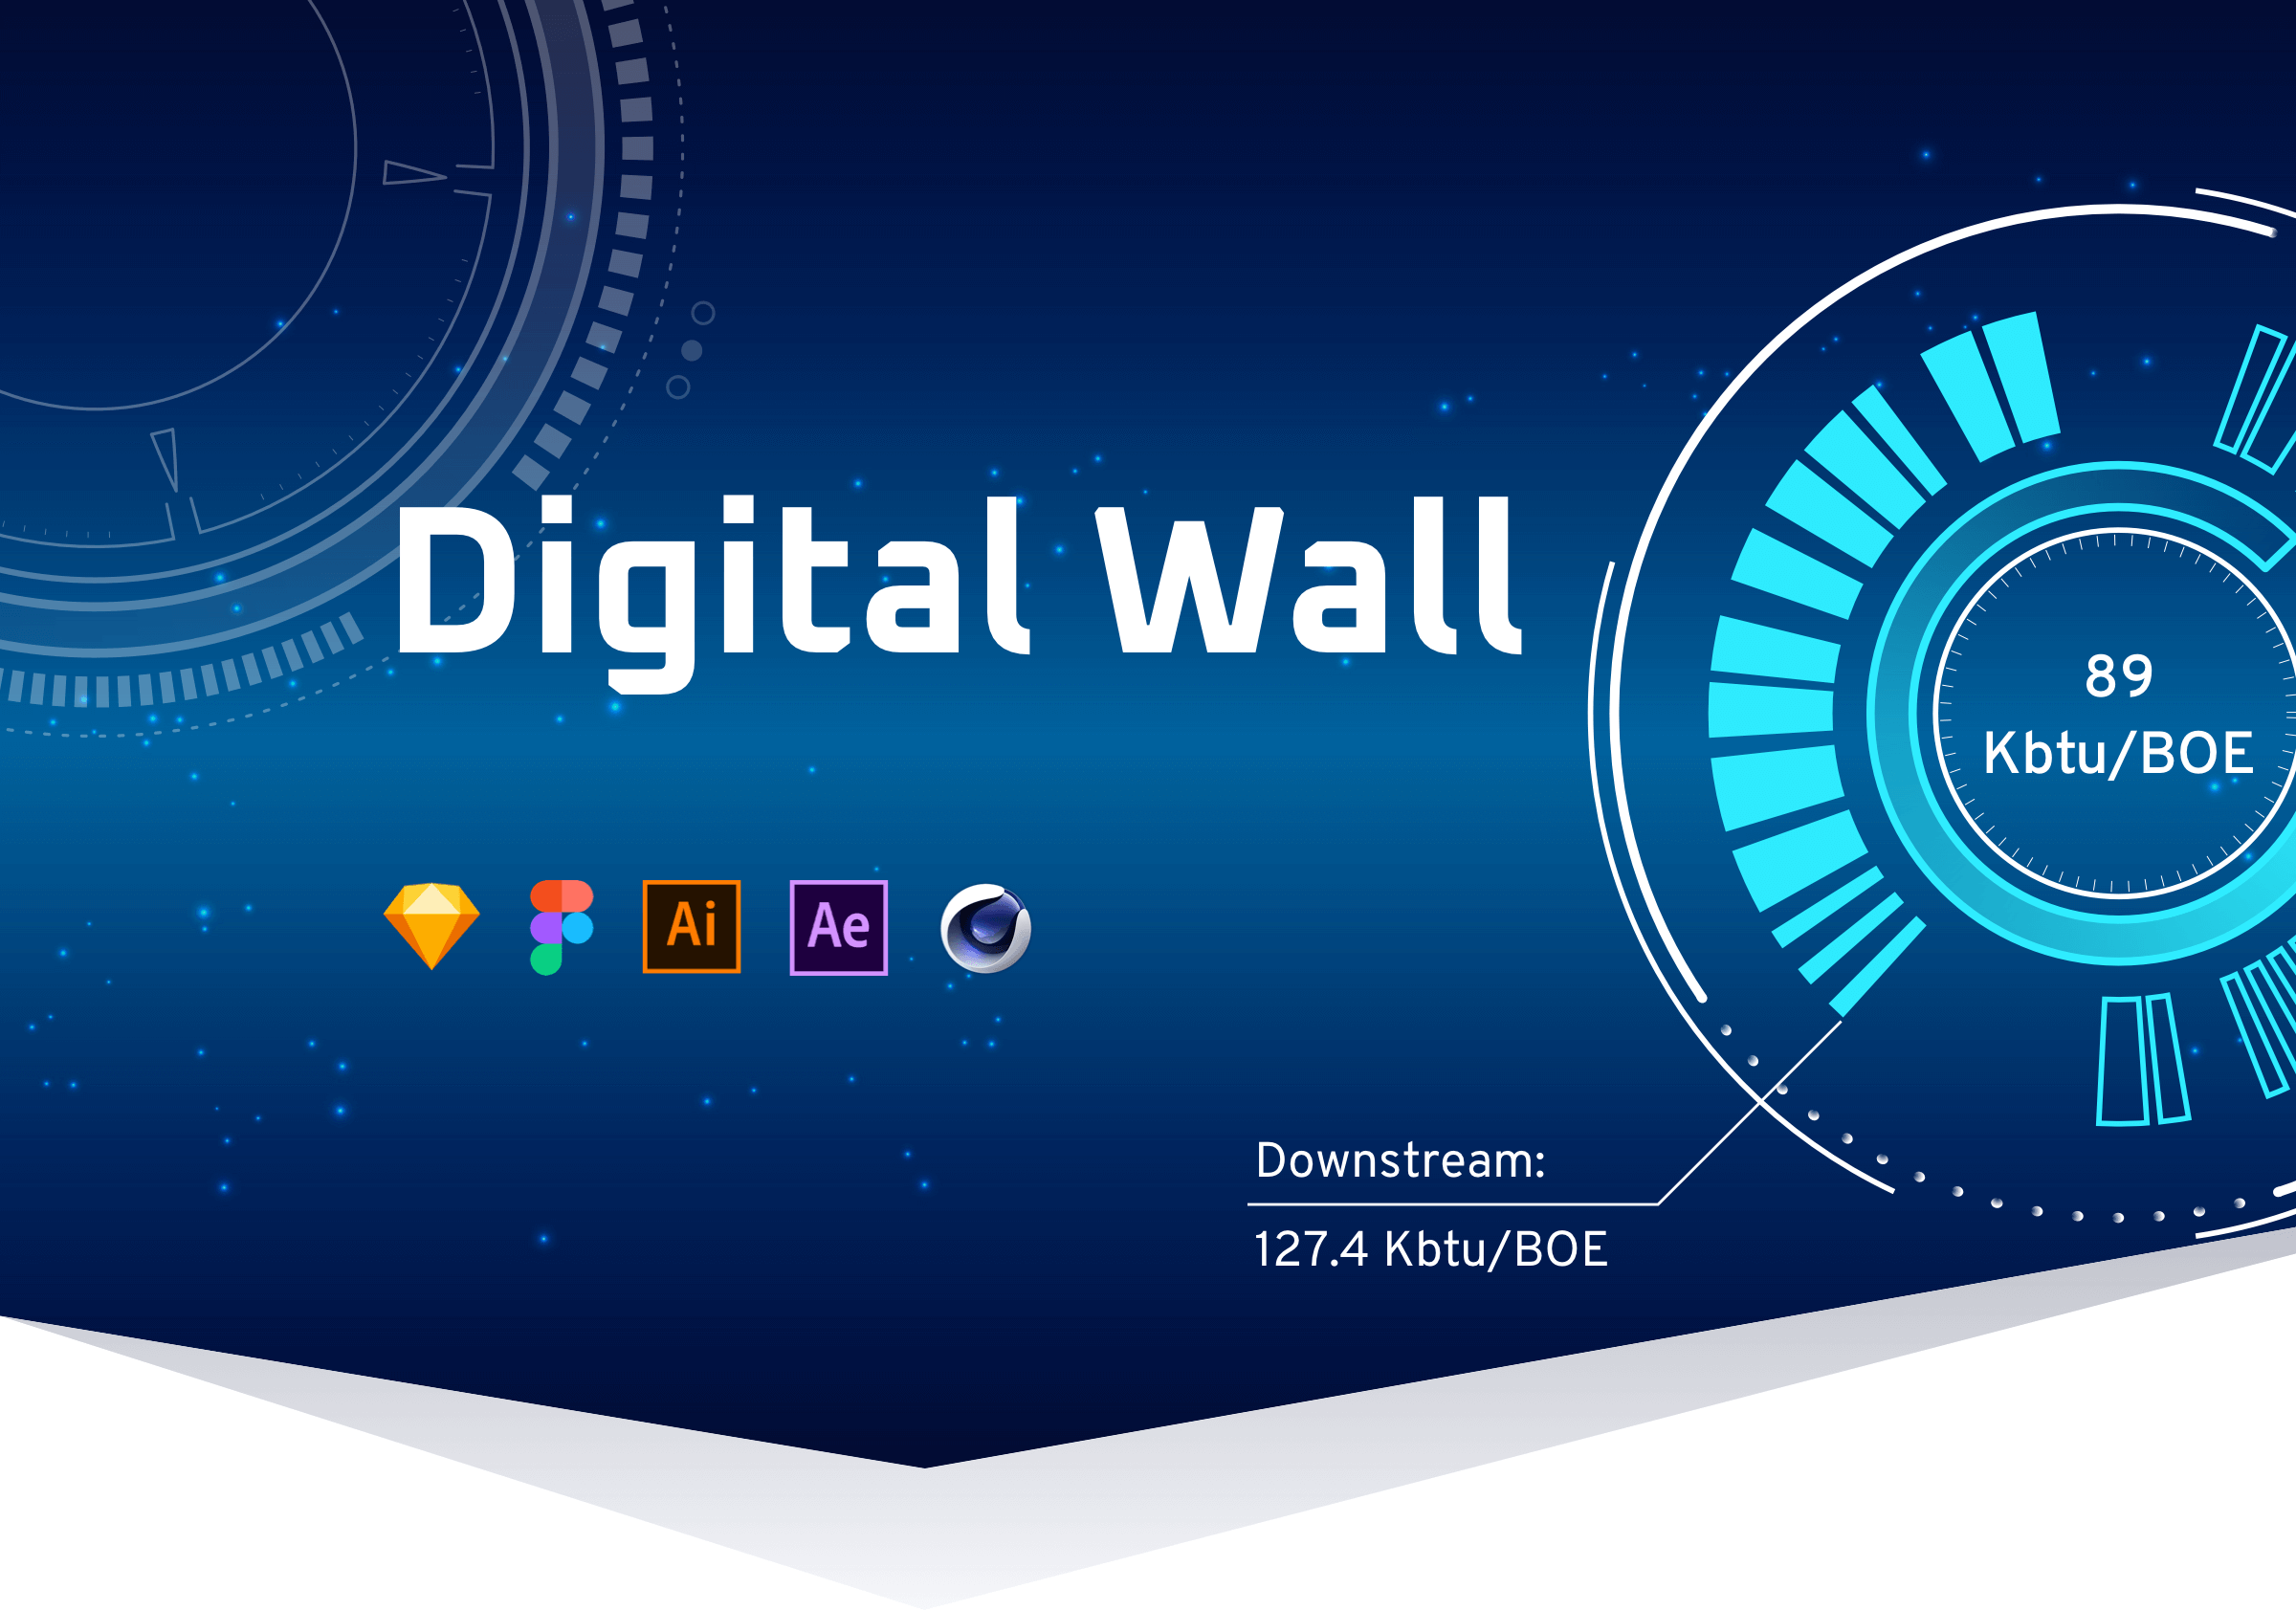
Digital Wall Experience Design
The goal was to create the incredible innovative presentation modes (themes) dedicated to hosting the upcoming international economic forum.
The presentations should cover the whole Digital Wall screen, which is the largest (by pixels per inch) Digital Wall in the world.
The goal was also to visualize the Company’s use of AI technologies to develop and transform the O&G operations and provide top-notch asset management.
The existing dashboards were built with traditional BI software applications, which were powerful enough for data processing, but their visual arsenal was scarce and uninspiring.
That’s why the Company wanted to uplift the visual experience during the high visits.
Main design message was to show how Safe (Health Safety and Environment), Reliable, Efficient and Qualitative the Company and the end products were.
Technical limitations: Screen parameters: Length - 45 meters, Height - 3 meters; Encoders support only 4k resolution (2160x3840).
Management: Project management, contract, schedules, technical architecture validation, business requirements collection, client communication (before the team came onsite) was covered by the contractor company.
Outcome: Static and animated versions of 16 dashboards, fully prepared for the implementation; Design system and Bonus Welcome Screen
Tools: Sketch, Figma, Adobe Illustrator, Adobe After Effects, Cinema 4d, Trello, Overflow
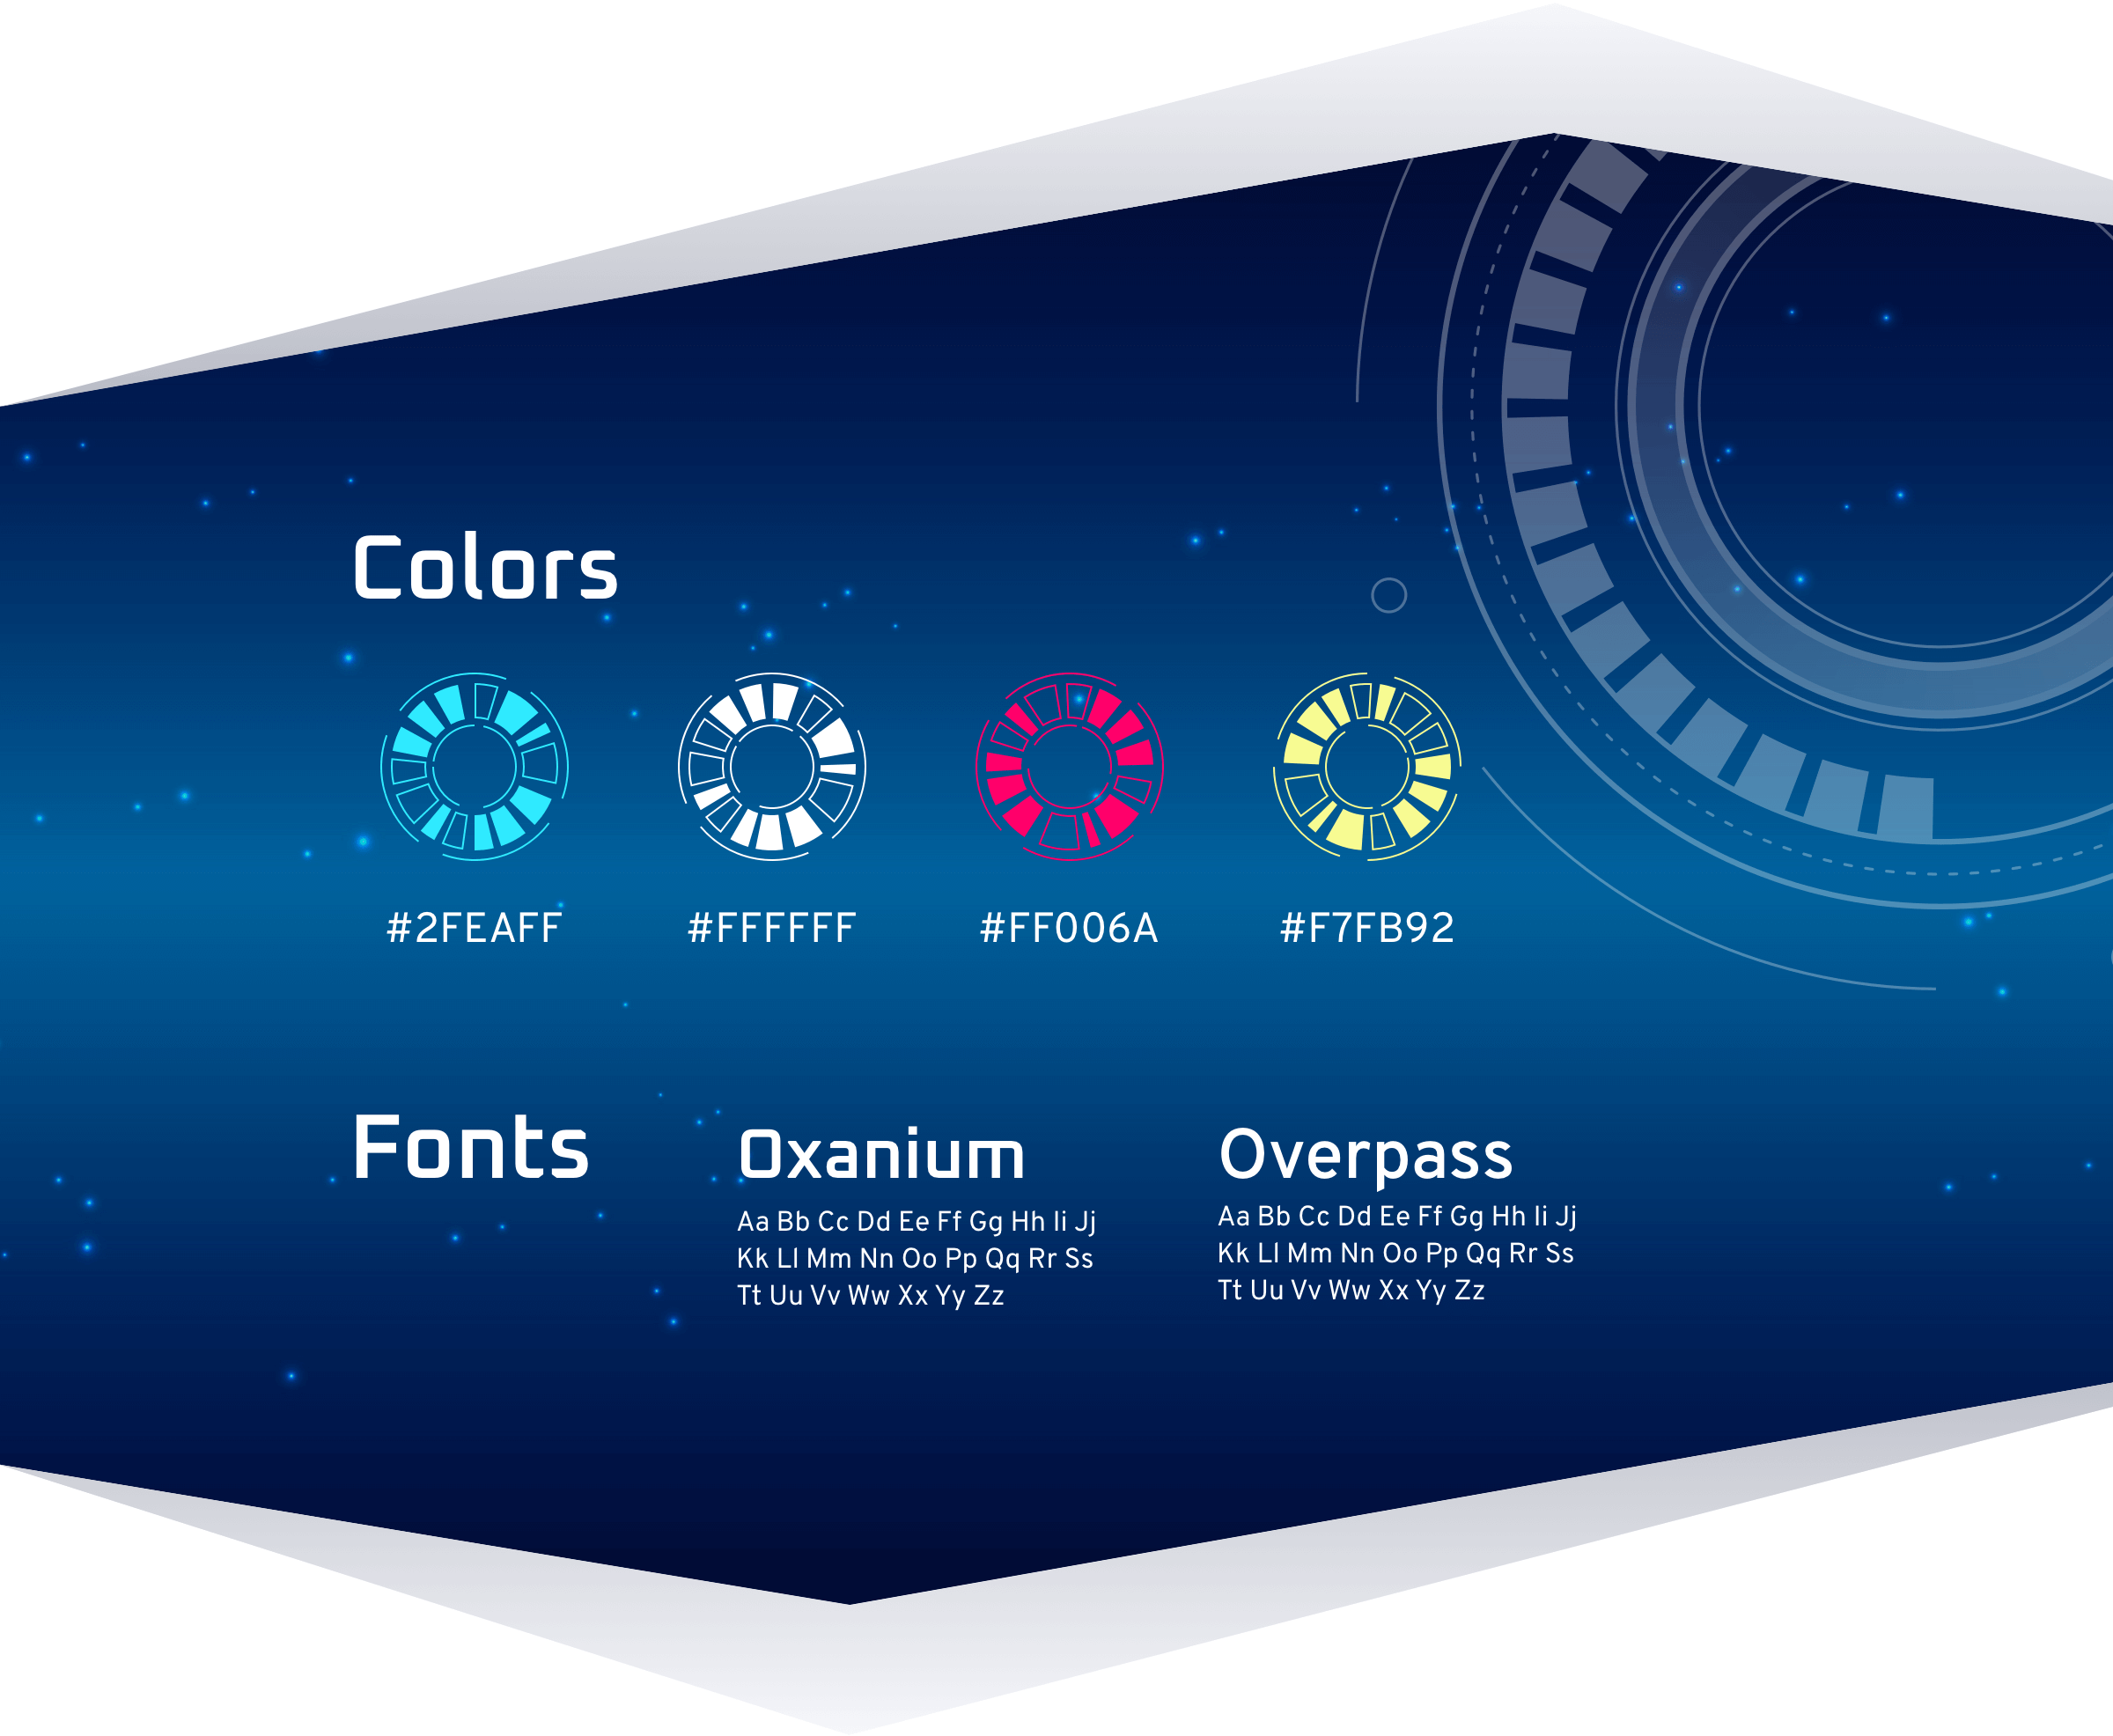
Components unification
During the design process, we were constantly updated with new requirements. So the challenge was to find comparable elements, make reusable components and unify the design system.
The project wasn’t similar to the typical websites or applications, and we created guidelines featuring all of the components in context. This way we unified all of the assets and provided clear use cases for the team.
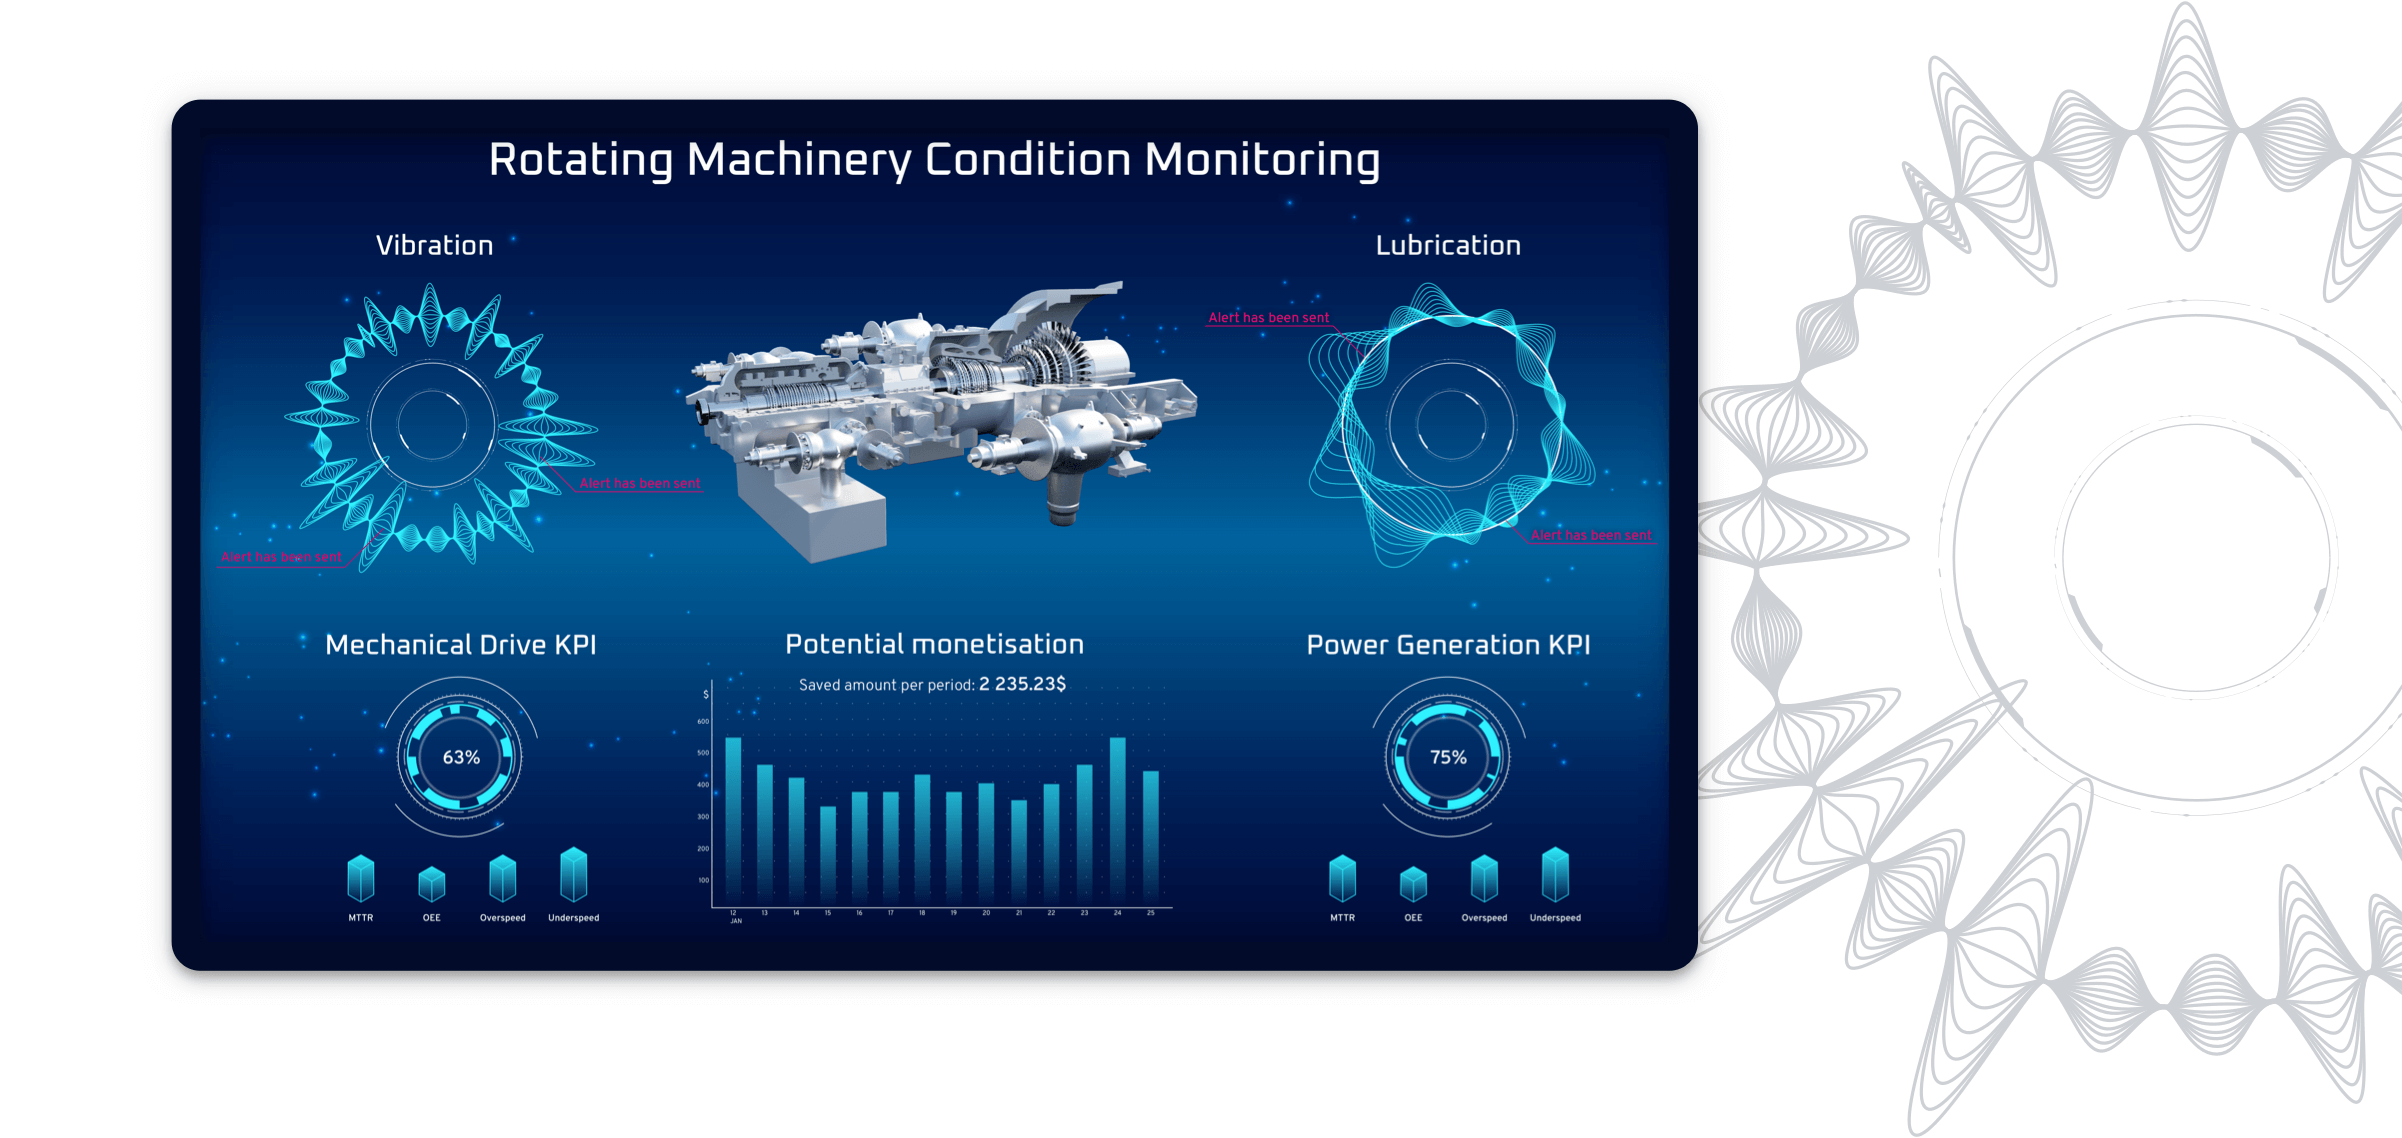
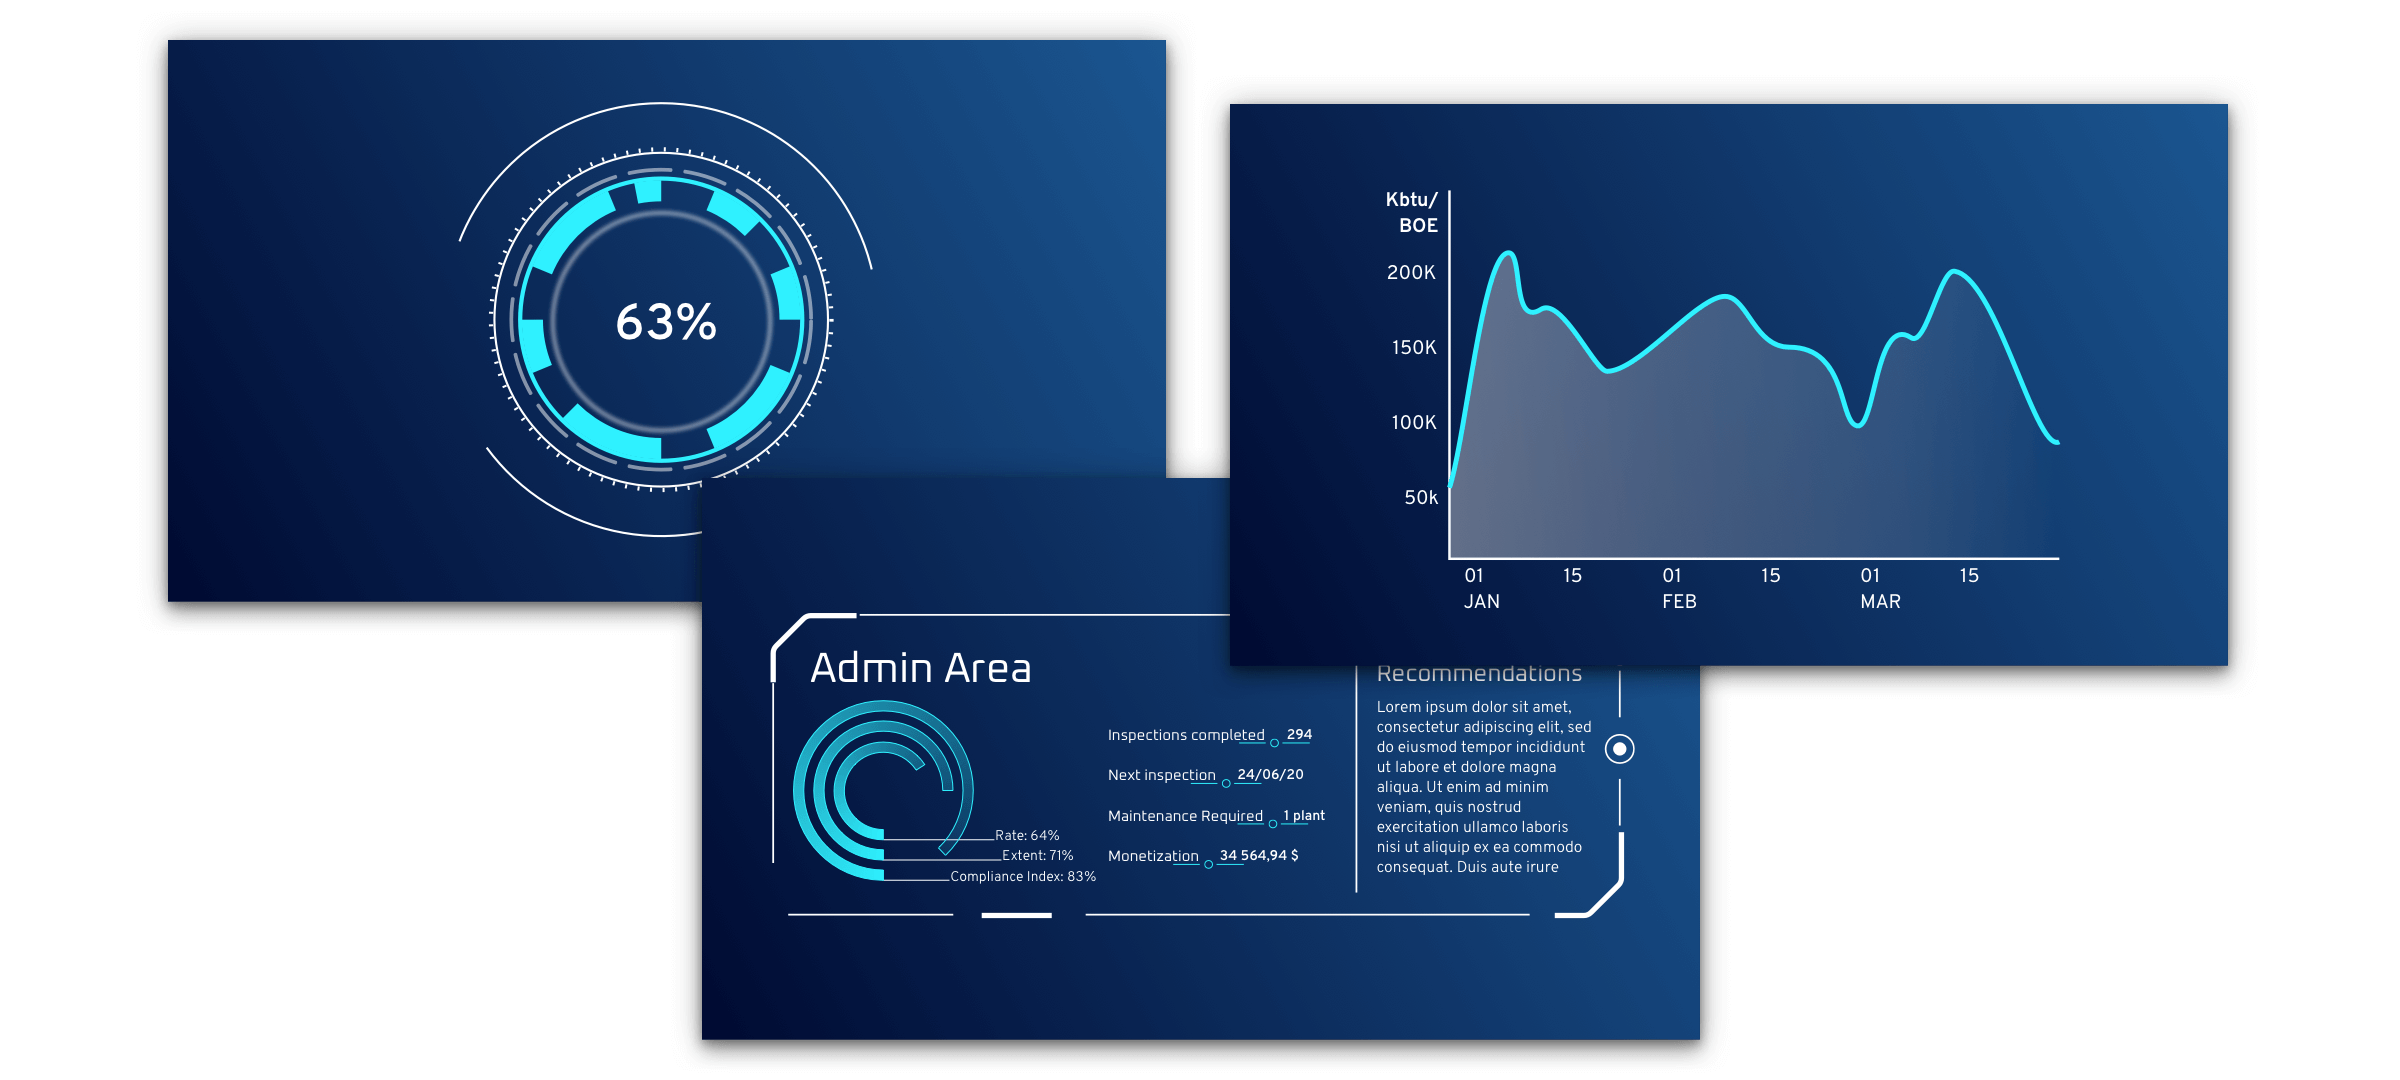
Rotating machinery
This dashboard displays the current and predicted status of the rotating equipment: gas, steam turbines and other machinery across all plants.
The goal is to detect and prevent trips and other failures, as well as visualise the equipment parts to provide the most realistic feel to the user. There is also the corporate value displayed (indicating the cost efficiency of the solution).
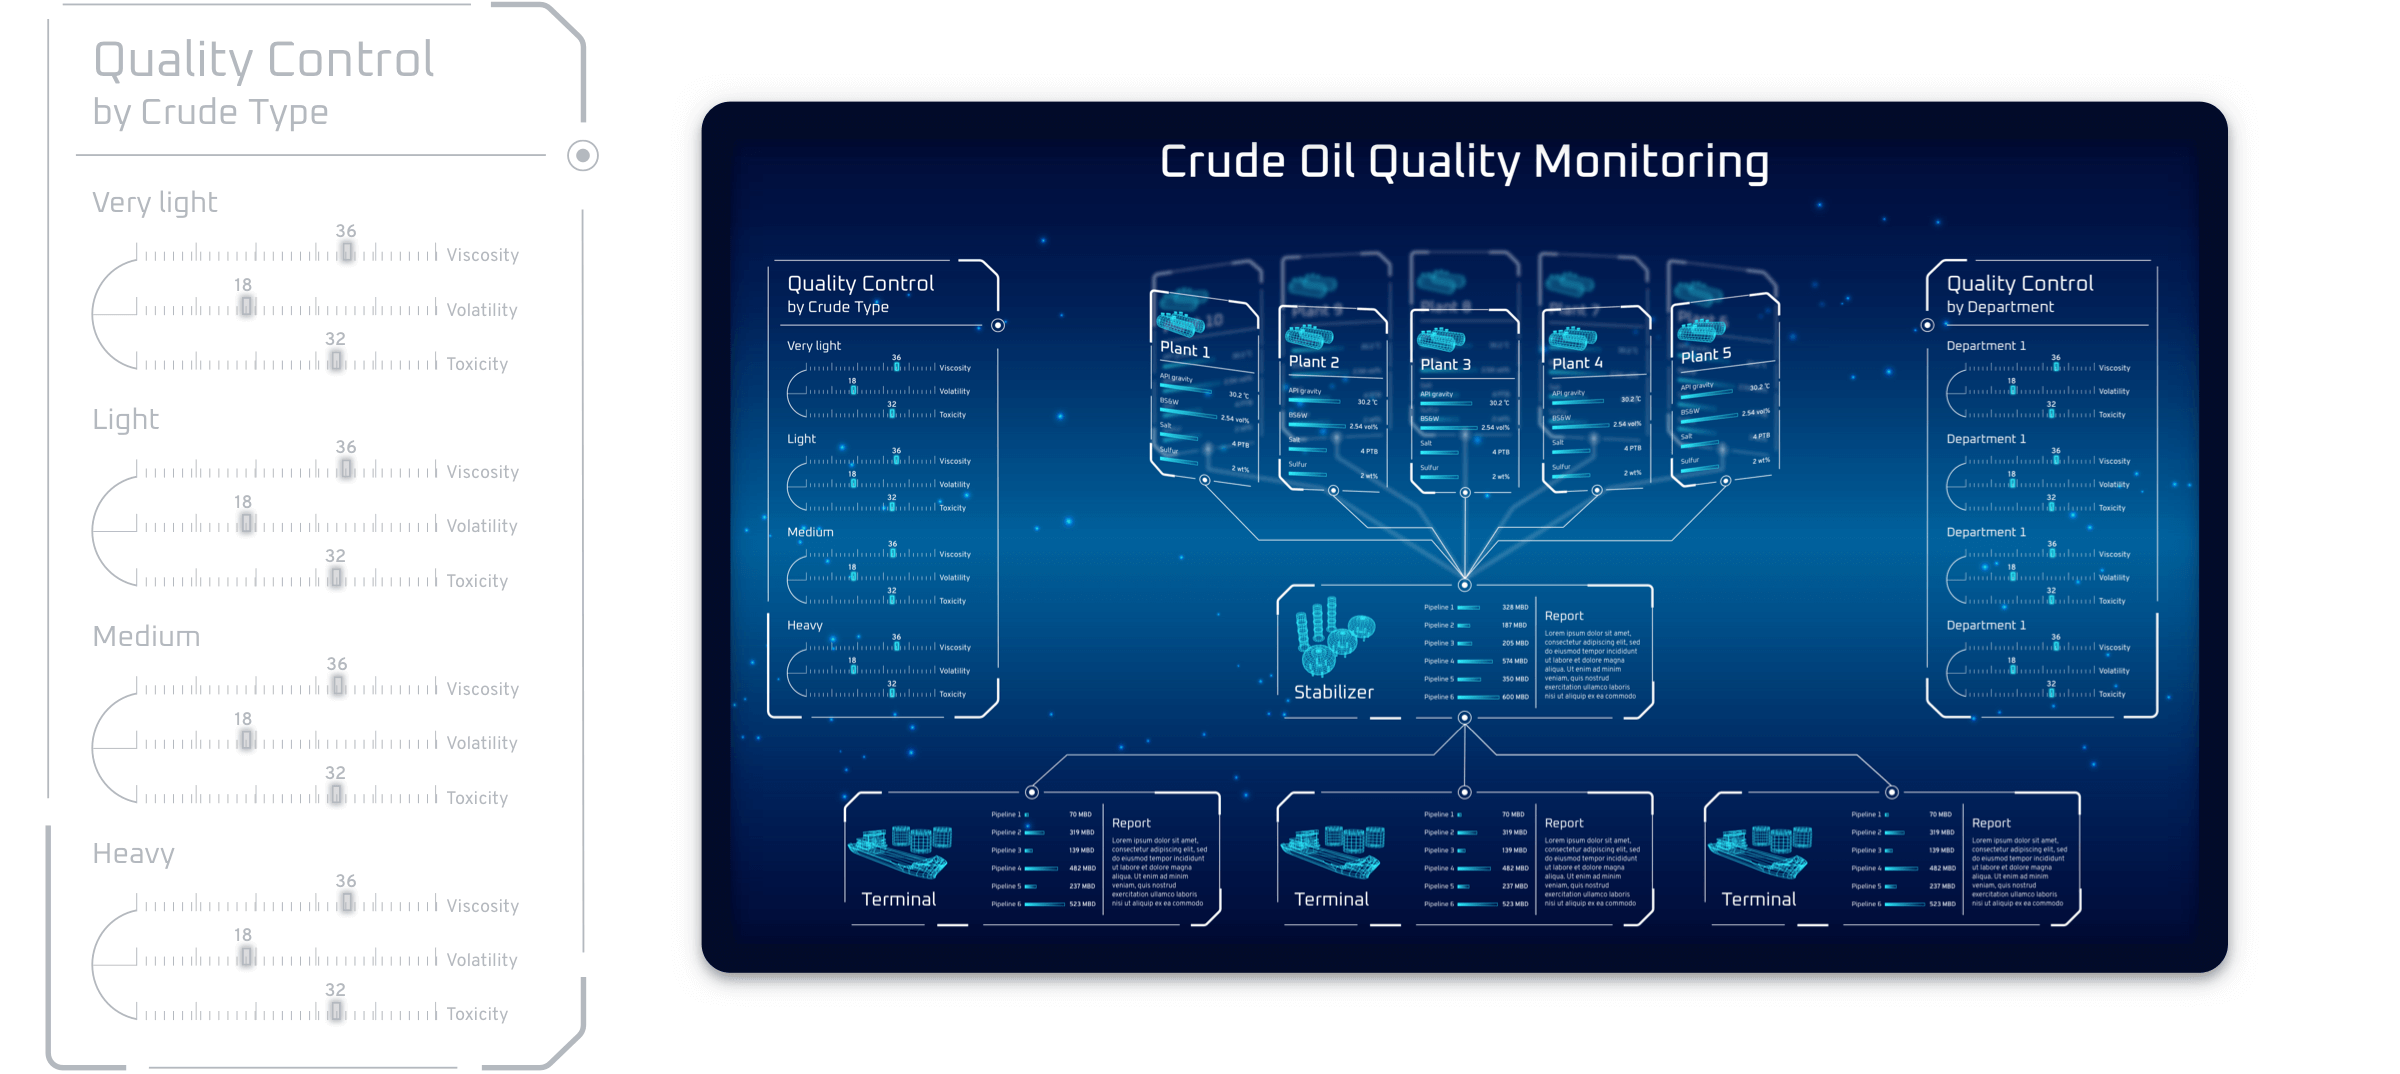
Crude quality
Thanks to the unique design solution the viewer can see around 40 plants and the whole crude oil processing chain with all solution specific parameters in a clear, clutter-free way.
The subject matter expert can get instant understanding of the facilities that require immediate attention and the parameters that may potentially fail in the near future.
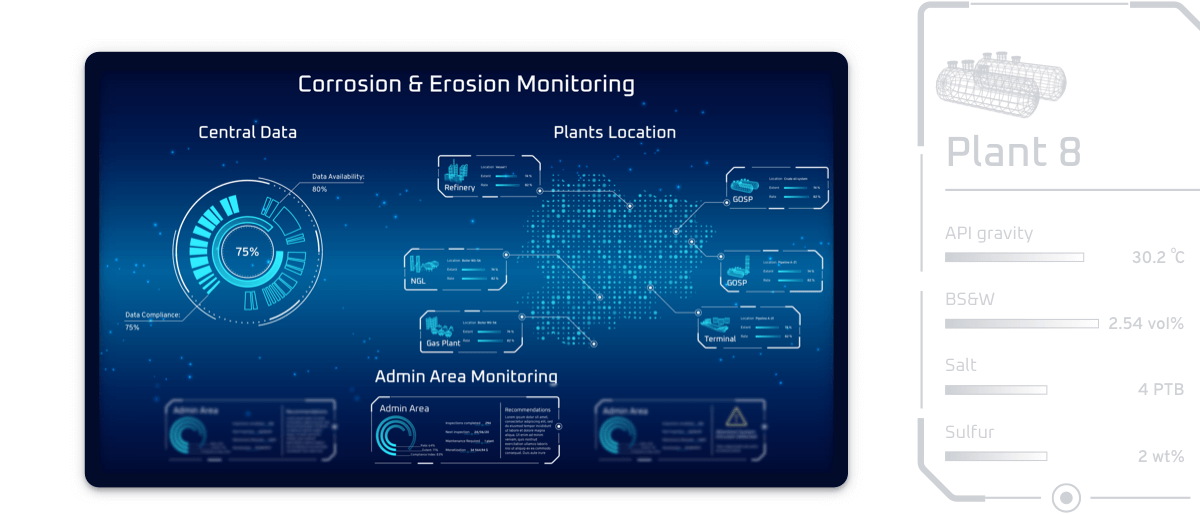
Corrosion monitoring
This dashboard displays a cost effective solution for monitoring and preventing corrosion and erosion.
The system inspects the vessels, pipelines and systems across all plants and detects corrosion location, extent, rate, underlying causes and alarms the concerned engineers.
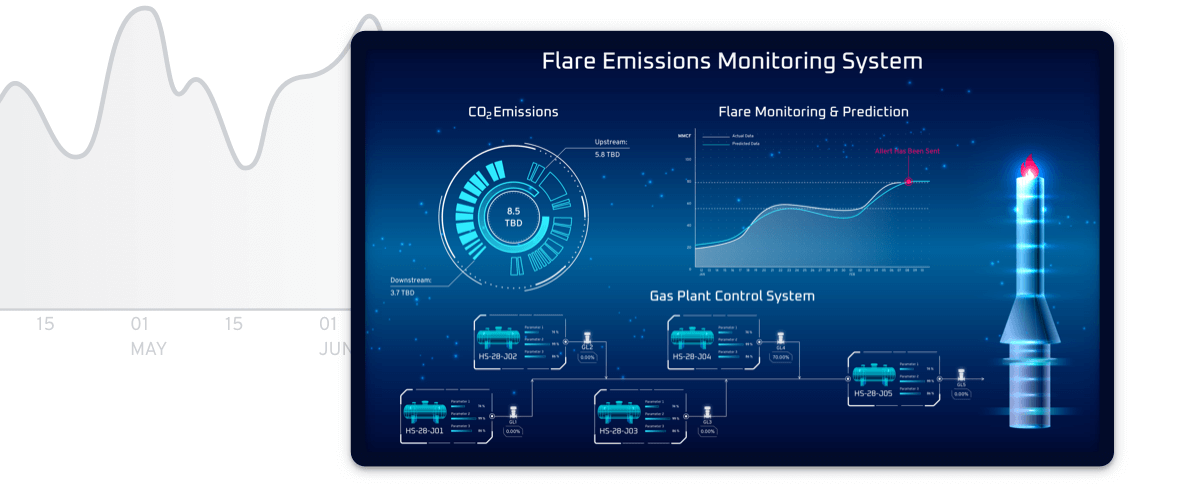
Flare monitoring
The Company has an ambitious goal to minimise gas flaring, so the designed dashboard allows to not only to monitor, but to actually control and prevent flaring and the subsequent emissions.
As the design team, we were eager to create an innovative, up-to-date, unapologetic design that no other player in this industry has and that will also be usable for the employees’ daily operations.
What’s more, we had to compete with another design studio hired by the Client and eventually our design solutions were chosen to be implemented into the Digital Wall.